http://xmodulo.com/gdb-command-line-debugger.html
What is the worst part of coding without a debugger? Compiling on your knees praying that nothing will crash? Running the executable with a blood offering? Or just having to write printf("test") at every line hoping to find where the problem is coming from? As you probably know, there are not many advantages to coding without a debugger. But the good side is that debugging on Linux is easy. While most people use the debugger included in their favorite IDE, Linux is famous for its powerful command line C/C++ debugger: GDB. However, like most command line utilities, GDB requires a bit of training to master fully. In this tutorial, I will give you a quick rundown of GDB debugger.
For Debian or Ubuntu:
We can now start playing around placing breakpoints anywhere in the source code with debugger. Here you have the options to set a breakpoint at a line number of the current source file:
which will have an effect of stopping me at "a++;" after 97 iterations of the for loop. As you have guessed, this is very handy when you do not want to step through the loop 97 times on your own.
Last but not least, you can place a "watchpoint" which will pause the program if a variable is modified:
Once our breakpoints are set, we can run the program with the "run" command, or simply:
And without surprises, we are stopped at line 11. From there, we can do interesting things. The command:
Of course:
And since we are playing with fire, might as well do it all the way:
And just like any good debugger, we can "step" with:
And to finish testing, you can delete a breakpoint with:
What do you think of GDB? Would you consider its advantages over a graphical debugger or an IDE's? And what about integrating into Vim? Let us know in the comments.
What is the worst part of coding without a debugger? Compiling on your knees praying that nothing will crash? Running the executable with a blood offering? Or just having to write printf("test") at every line hoping to find where the problem is coming from? As you probably know, there are not many advantages to coding without a debugger. But the good side is that debugging on Linux is easy. While most people use the debugger included in their favorite IDE, Linux is famous for its powerful command line C/C++ debugger: GDB. However, like most command line utilities, GDB requires a bit of training to master fully. In this tutorial, I will give you a quick rundown of GDB debugger.
Installation of GDB
GDB is available in most distributions' repositories.For Debian or Ubuntu:
$ sudo apt-get install gdb
For Arch Linux:
$ sudo pacman -S gdb
For Fedora, CentOS or RHEL:
$ sudo yum install gdb
If you cannot find it anywhere else, it is always possible to download it from the official page.Code Sample
When you are learning GDB, it is always better to have a piece of code to try things. Here is a quick sample that I coded to show the best features of GDB. Feel free to copy paste it to try the examples. That's the best way to learn.
1
2
3
4
5
6
7
8
9
10
11
12
13
14
15
16
17
| #include #include int main(int argc, char **argv){ int i; int a=0, b=0, c=0; double d; for (i=0; i<100 code="" i=""> { a++; if (i>97) d = i / 2.0; b++; } return 0;} |
Usage of GDB
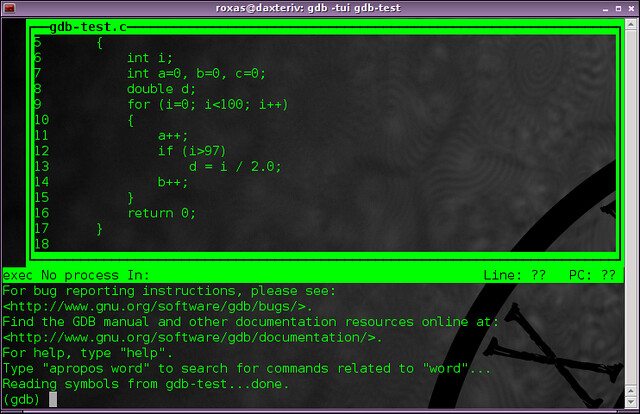
First and foremost, you will need to compile your program with the flag "-g" (for debug) to run it via GDB. From there the syntax to start debugging is:
$ gdb -tui [executable's name]
The "-tui” option will show your code in a nice interactive terminal
window (so-called "text user interface") that you can navigate in with
the arrow keys, while typing in the GDB shell below.We can now start playing around placing breakpoints anywhere in the source code with debugger. Here you have the options to set a breakpoint at a line number of the current source file:
break [line number]
or at a line number of a specific source file:
break [file name]:[line number]
or at a particular function:
break [function name]
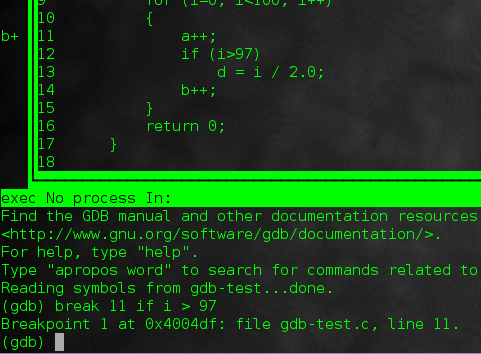
And even better, you can set conditional breakpoints:
break [line number] if [condition]
For example, in our code sample, I can set:
break 11 if i > 97
which will have an effect of stopping me at "a++;" after 97 iterations of the for loop. As you have guessed, this is very handy when you do not want to step through the loop 97 times on your own.
Last but not least, you can place a "watchpoint" which will pause the program if a variable is modified:
watch [variable]
Here, I can set one like:
watch d
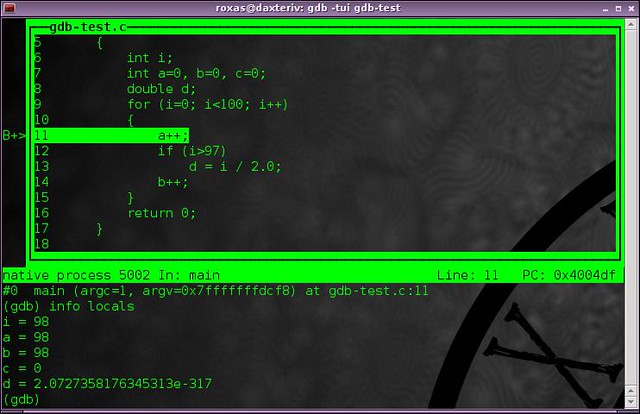
which will stop the program as soon as variable d is set to a new value (i.e. when i > 97 is true).Once our breakpoints are set, we can run the program with the "run" command, or simply:
r [command line arguments if your program takes some]
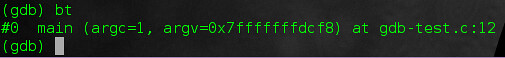
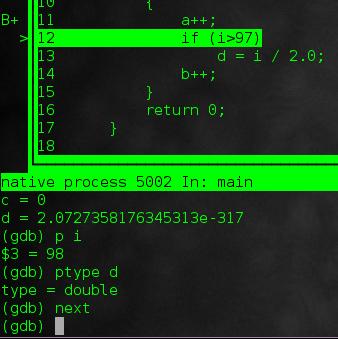
as most words can be abbreviated in just a letter with gdb.And without surprises, we are stopped at line 11. From there, we can do interesting things. The command:
bt
for backtrack will tell us how we got to that point.
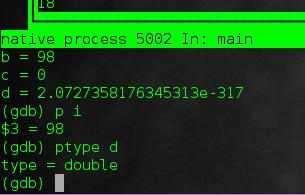
info locals
will display all the local variables and their current values (as you can see I didn't set my d variable to anything so its value is currently garbage).Of course:
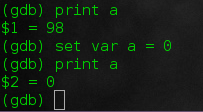
p [variable]
will show the value of a particular variable. But even better:
ptype [variable]
shows the type of a local variable. So here we can confirm that d is double type.And since we are playing with fire, might as well do it all the way:
set var [variable] = [new value]
will override the value of the variable. Be careful though as you
can't create a new variable or change its type. But here we can do:
set var a = 0
And just like any good debugger, we can "step" with:
step
to run the next line and potentially step into a function. Or just:
next
to just go straight to the line below, ignoring any function call. And to finish testing, you can delete a breakpoint with:
delete [line number]
Keep running the program from the current breakpoint with:
continue
and exit GDB with:
quit
To conclude, with GDB, no more praying to compile, no more blood
offerings to run, no more printf("test"). Of course this post is not
exhaustive and GDB's capabilities run beyond this, so I really encourage
you to learn more about it on your own (or in a future post maybe?).
What I am the most interested now is to integrate GDB nicely in Vim. In
the meantime, here is a very big memo of all the GDB commands for future reference.What do you think of GDB? Would you consider its advantages over a graphical debugger or an IDE's? And what about integrating into Vim? Let us know in the comments.

No comments:
Post a Comment