http://www.linux.com/learn/tutorials/765381-five-funny-little-linux-network-testers-and-monitors
In this roundup of Linux network testing utilities we use Bandwidthd, Speedometer, Nethogs, Darkstat, and iperf to track bandwidth usage, speed, find network hogs, and test performance.
 Bandwidthd has almost no documentation.
 You can measure your hard drive's raw write speed by using
 Click the automatic reload button to make it update in real time. The
Hosts tab shows who you're connected to, how long you've been
connected, and how much traffic, in bytes, has passed between you.
You can run Darkstat as a daemon and have it start at boot. How to do this depends on your Linux distribution, and what init system you are using (Upstart, systemd, sysvinit, BSD init). I shall leave it as your homework to figure this out.
There is a new version of
In this roundup of Linux network testing utilities we use Bandwidthd, Speedometer, Nethogs, Darkstat, and iperf to track bandwidth usage, speed, find network hogs, and test performance.
Bandwidthd
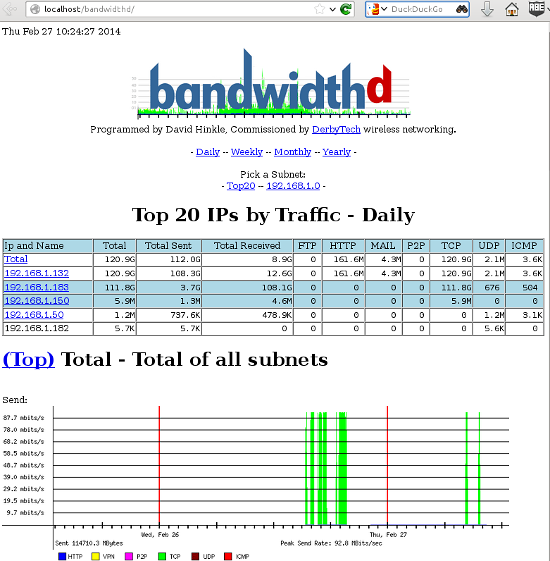
Bandwidthd is a funny little app that hasn't been updated since 2005, but (at least on my Kubuntu system) it still works. It makes nice colorful graphs of your incoming and outgoing bandwidth usage, and tallies it up by day, week, month, and year on a Web page. So you also need Apache, or some other HTTP server. You can monitor a single PC, or everyone on your LAN. This is a nice app for tracking your monthly usage if you need to worry about bandwidth caps.
Figure 1: Pretty Bandwidthd graphs.
man bandwidthd lists all of its configuration files and directories. Its Sourceforge page is even sparser. There are two versions: bandwidthd and bandwidthd-pgsql. bandwidthd generates static HTML pages every 150 seconds, and bandwidthd-pgsql displays
graphs and data on dynamic PHP pages. The Web page says "The visual
output of both is similar, but the database driven system allows for
searching, filtering, multiple sensors and custom reports." I suppose if
you want to search, filter, do multiple sensors, or create custom
reports you'll have to hack PHP files. Installation on my system was
easy, thanks to the Debian and Ubuntu package maintainers. It created
the Apache configuration and set up PostgreSQL, and then all I had to do
was open a Web browser to http://localhost/bandwidthd which is not documented anywhere, except in configuration files, so you heard it here first.Speedometer
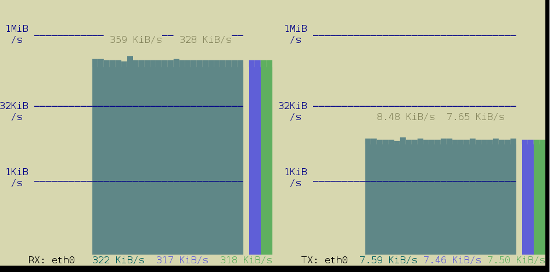
Speedometer displays real-time graphs on the console (so you don't need a Web server) of how fast data are moving across your network connection, and it also answers the question "How fast is my hard drive?" The simplest usage displays either received or transmitted bytes per second. This called a tap:$ speedometer -r eth0$ speedometer -r eth0 -t eth0-c option makes nice columns instead, and -k 256 displays 256 colors instead of the default 16, as in figure 2.$ speedometer -r eth0 -c -t eth0
Figure 2: Speedometer tracking incoming and outgoing traffic in 256 colors and columns.
dd to create a 1-gigabyte raw file, and then use Speedometer to measure how long it takes to create it:$ dd bs=1000000 count=1000 if=/dev/zero of=testfile & speedometer testfilecount value to generate a different file size; for example count=2000 creates a 2GB file. You can also experiment with different block sizes (bs) to see if that makes a difference. Remember to delete the testfile when you're finished, unless you like having useless large files laying around.Nethogs
Nethogs is a simple console app that displays bandwidth per process, so you can quickly see who is hogging your network. The simplest invocation specifies your network interface, and then it displays both incoming and outgoing packets:$ sudo nethogs eth0
NetHogs version 0.8.0
PID USER PROGRAM DEV SENT RECEIVED
1703 carla ssh eth0 9702.096 381.697 KB/sec
5734 www-data /usr/bin/fie eth0 1.302 59.301 KB/sec
13113 carla ..lib/firefox/firefox eth0 0.021 0.023 KB/sec
2462 carla ..oobar/lib/foobar eth0 0.000 0.000 KB/sec
? root unknown TCP 0.000 0.000 KB/sec
TOTAL 9703.419 441.021 KB/sec -r option to show only received packets, and -s to see only sent packets.Darkstat
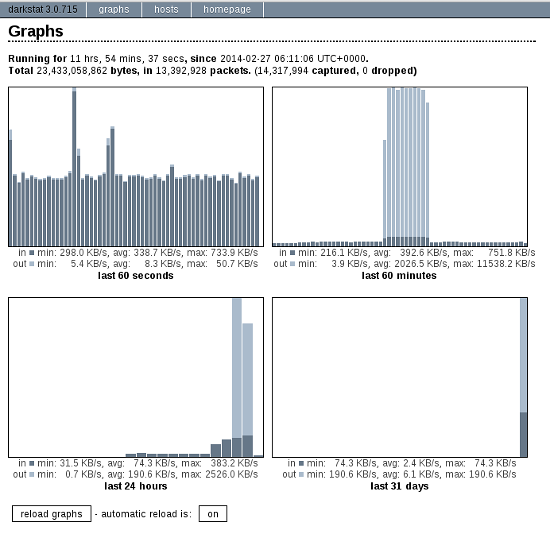
Darkstat is another Web-based network monitor, but it includes its own embedded HTTP server so you don't need Apache. Start it up with the name of your network interface as the only option:$ sudo darkstat -i eth0
Figure 3: Darkstat's default display.
You can run Darkstat as a daemon and have it start at boot. How to do this depends on your Linux distribution, and what init system you are using (Upstart, systemd, sysvinit, BSD init). I shall leave it as your homework to figure this out.
iperf
Doubtless you fine readers have been wondering "What about iperf?" Well, here it is.iperf reports
bandwidth, delay jitter, and datagram loss. In other words, it tests
link quality, which is a big deal for streaming media such as music,
videos, and video calls. You need to install iperf on both ends of the link you want to test, which in these examples are Studio and Uberpc. Then start iperf in
server mode on one host, and run it in client mode on the other host.
Note that on the client, you must name the server. This is the simplest
way to run a test:carla@studio:~$ iperf -s
terry@uberpc:~$ iperf -c studiocarla@studio:~$ iperf -s
------------------------------------------------------------
Server listening on TCP port 5001
TCP window size: 85.3 KByte (default)
------------------------------------------------------------
[ 4] local 192.168.1.132 port 5001 connected with 192.168.1.182 port 32865
[ ID] Interval Transfer Bandwidth
[ 4] 0.0-10.0 sec 1.09 GBytes 938 Mbits/sec
terry@uberpc:~$ iperf -c studio
------------------------------------------------------------
Client connecting to studio, TCP port 5001
TCP window size: 22.9 KByte (default)
------------------------------------------------------------
[ 3] local 192.168.1.182 port 32865 connected with 192.168.1.132 port 5001
[ ID] Interval Transfer Bandwidth
[ 3] 0.0-10.0 sec 1.09 GBytes 938 Mbits/secterry@uberpc:~$ iperf -c studio -d
------------------------------------------------------------
Server listening on TCP port 5001
TCP window size: 85.3 KByte (default)
------------------------------------------------------------
------------------------------------------------------------
Client connecting to studio, TCP port 5001
TCP window size: 54.8 KByte (default)
------------------------------------------------------------
[ 5] local 192.168.1.182 port 32980 connected with 192.168.1.132 port 5001
[ 4] local 192.168.1.182 port 5001 connected with 192.168.1.132 port 47130
[ ID] Interval Transfer Bandwidth
[ 5] 0.0-10.0 sec 1020 MBytes 855 Mbits/sec
[ 4] 0.0-10.0 sec 1.07 GBytes 920 Mbits/sec
Ctrl+c, and then restart it with iperf -su. On the client try:$ iperf -c studio -ub 900m-b 900m means run the test at 900 megabits per second,
so you need to adjust this for your network, and to test different
speeds. A good run looks like this:[ ID] Interval Transfer Bandwidth Jitter Lost/Total Datagrams
[ 3] 0.0-10.0 sec 958 MBytes 803 Mbits/sec 0.013 ms 1780/684936 (0.26%)
[ 3] 0.0-10.0 sec 1 datagrams received out-of-order
There is a new version of
iperf, and that is iperf 3.0.1.
Supposedly this is going to replace iperf2 someday. It has been
rewritten from scratch so it's all spiffy clean and not crufty, and it
includes a library version that can be used in other programs. It's
still a baby so expect rough edges.
No comments:
Post a Comment